Aggregating and reporting simple blog analytics with Exlytics
(revised on )
Since my last post, I made a large architectural change to Exlytics. I replaced Google Firestore with TimescaleDB to store and aggregate page views and click events. Part of my rationale is a desire to explore Kubernetes and run a database on that orchestration service. The other reason is that TimescaleDB is designed to aggregate time-series data with almost no effort.
Storing and aggregating page views
Exlytics' schema is still very simple:
                                                 Table "public.events"
   Column    |              Type              | Collation | Nullable | Default | Storage  | Stats target | Description
-------------+--------------------------------+-----------+----------+---------+----------+--------------+-------------
 time        | timestamp without time zone    |           | not null |         | plain    |              |
 metadata    | jsonb                          |           |          |         | extended |              |
 inserted_at | timestamp(0) without time zone |           | not null |         | plain    |              |
 updated_at  | timestamp(0) without time zone |           | not null |         | plain    |              |
Indexes:
    "events_metadata_index" gin (metadata)
    "events_time_idx" btree ("time" DESC)
    "events_time_metadata_index" btree ("time", metadata)
On top of this schema, I have created two continuous aggregates. TimescaleDB surfaces these as materialized views and updates them on a user-configurable cadence. For this post, I am going to be referencing the page views view:
CREATE VIEW page_views WITH (timescaledb.continuous) AS
SELECT
  time_bucket ('1day', time) AS day,
  metadata ->> 'host' as host,
  metadata ->> 'page' as page,
  count(1)
FROM
  events
GROUP BY
  day,
  host,
  page
;
                                    View "public.page_views"
 Column |            Type             | Collation | Nullable | Default | Storage  | Description
--------+-----------------------------+-----------+----------+---------+----------+-------------
 day    | timestamp without time zone |           |          |         | plain    |
 host   | text                        |           |          |         | extended |
 page   | text                        |           |          |         | extended |
 count  | bigint                      |           |          |         | plain    |
Very next on my to-do list for Exlytics is adding a site identifier so that the service can be used on multiple websites. Because TimescaleDB automatically indexes all dimensions, this will remain performant even with multiple site identifiers.
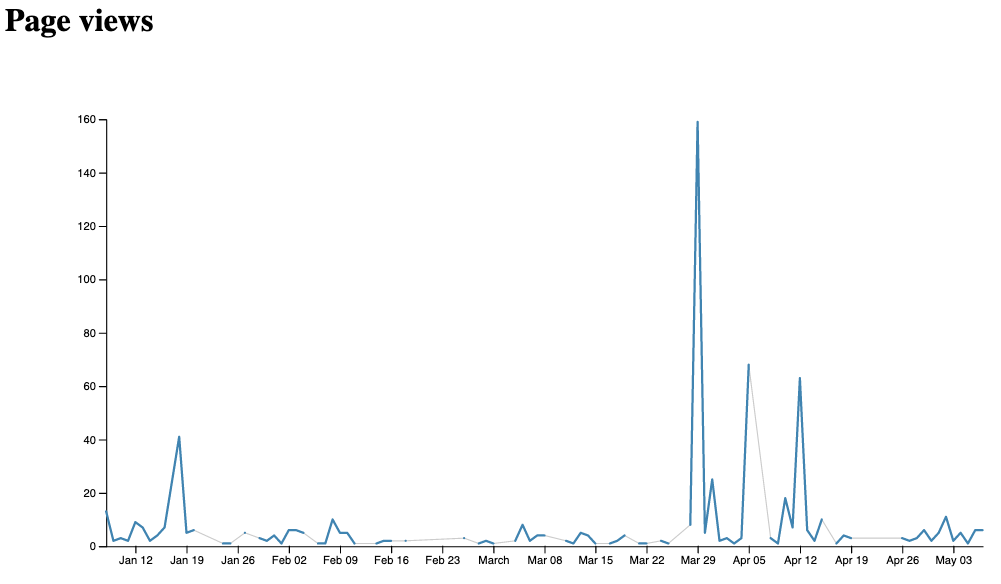
Reporting page views by day and page
D3.js is another technology skill I try to keep up-to-date. At a previous job, we built complex usage-reporting dashboards using v2 of D3. Building charts of page views and link clicks is trivial with D3.js.
I decoupled the event collection application from the reporting application. They are both simplistic enough to use a single application or an umbrella application. I wanted to use the Phoenix Framework for the dashboard application for later access to OAuth 2.0 and OpenID authentication plugins.
Exlytics Dashboard is open-source and is in a very simple state at the moment. Visualizations are a lot of fun to build.